Debugging
Before we write much more code, we will want to have some debugging tools in our belt for when things go wrong. Take a moment to review the reference page listing tools and approaches available for debugging Rust-generated WebAssembly.
Enable Logging for Panics
If our code panics, we want informative error messages to appear in the developer console.
Our wasm-pack-template comes with an optional, enabled-by-default dependency
on the console_error_panic_hook crate that is configured in
wasm-game-of-life/src/utils.rs. All we need to do is install the hook in an
initialization function or common code path. We can call it inside the
Universe::new constructor in wasm-game-of-life/src/lib.rs:
# #![allow(unused_variables)]
#fn main() {
pub fn new() -> Universe {
    utils::set_panic_hook();

    // ...
}
#}
Add Logging to our Game of Life
Let's use the console.log function via the web-sys crate to add some
logging about each cell in our Universe::tick function.
First, add web-sys as a dependency and enable its "console" feature in
wasm-game-of-life/Cargo.toml:
[dependencies.web-sys]
version = "0.3"
features = [
  "console",
]
For ergonomics, we'll wrap the console.log function up in a println!-style
macro:
# #![allow(unused_variables)]
#fn main() {
extern crate web_sys;

// A macro to provide `println!(..)`-style syntax for `console.log` logging.
macro_rules! log {
    ( $( $t:tt )* ) => {
        web_sys::console::log_1(&format!( $( $t )* ).into());
    }
}
#}
Now, we can start logging messages to the console by inserting calls to log in
Rust code. For example, to log each cell's state, live neighbors count, and next
state, we could modify wasm-game-of-life/src/lib.rs like this:
diff --git a/src/lib.rs b/src/lib.rs
index f757641..a30e107 100755
--- a/src/lib.rs
+++ b/src/lib.rs
@@ -123,6 +122,14 @@ impl Universe {
                 let cell = self.cells[idx];
                 let live_neighbors = self.live_neighbor_count(row, col);

+                log!(
+                    "cell[{}, {}] is initially {:?} and has {} live neighbors",
+                    row,
+                    col,
+                    cell,
+                    live_neighbors
+                );
+
                 let next_cell = match (cell, live_neighbors) {
                     // Rule 1: Any live cell with fewer than two live neighbours
                     // dies, as if caused by underpopulation.
@@ -140,6 +147,8 @@ impl Universe {
                     (otherwise, _) => otherwise,
                 };

+                log!("    it becomes {:?}", next_cell);
+
                 next[idx] = next_cell;
             }
         }
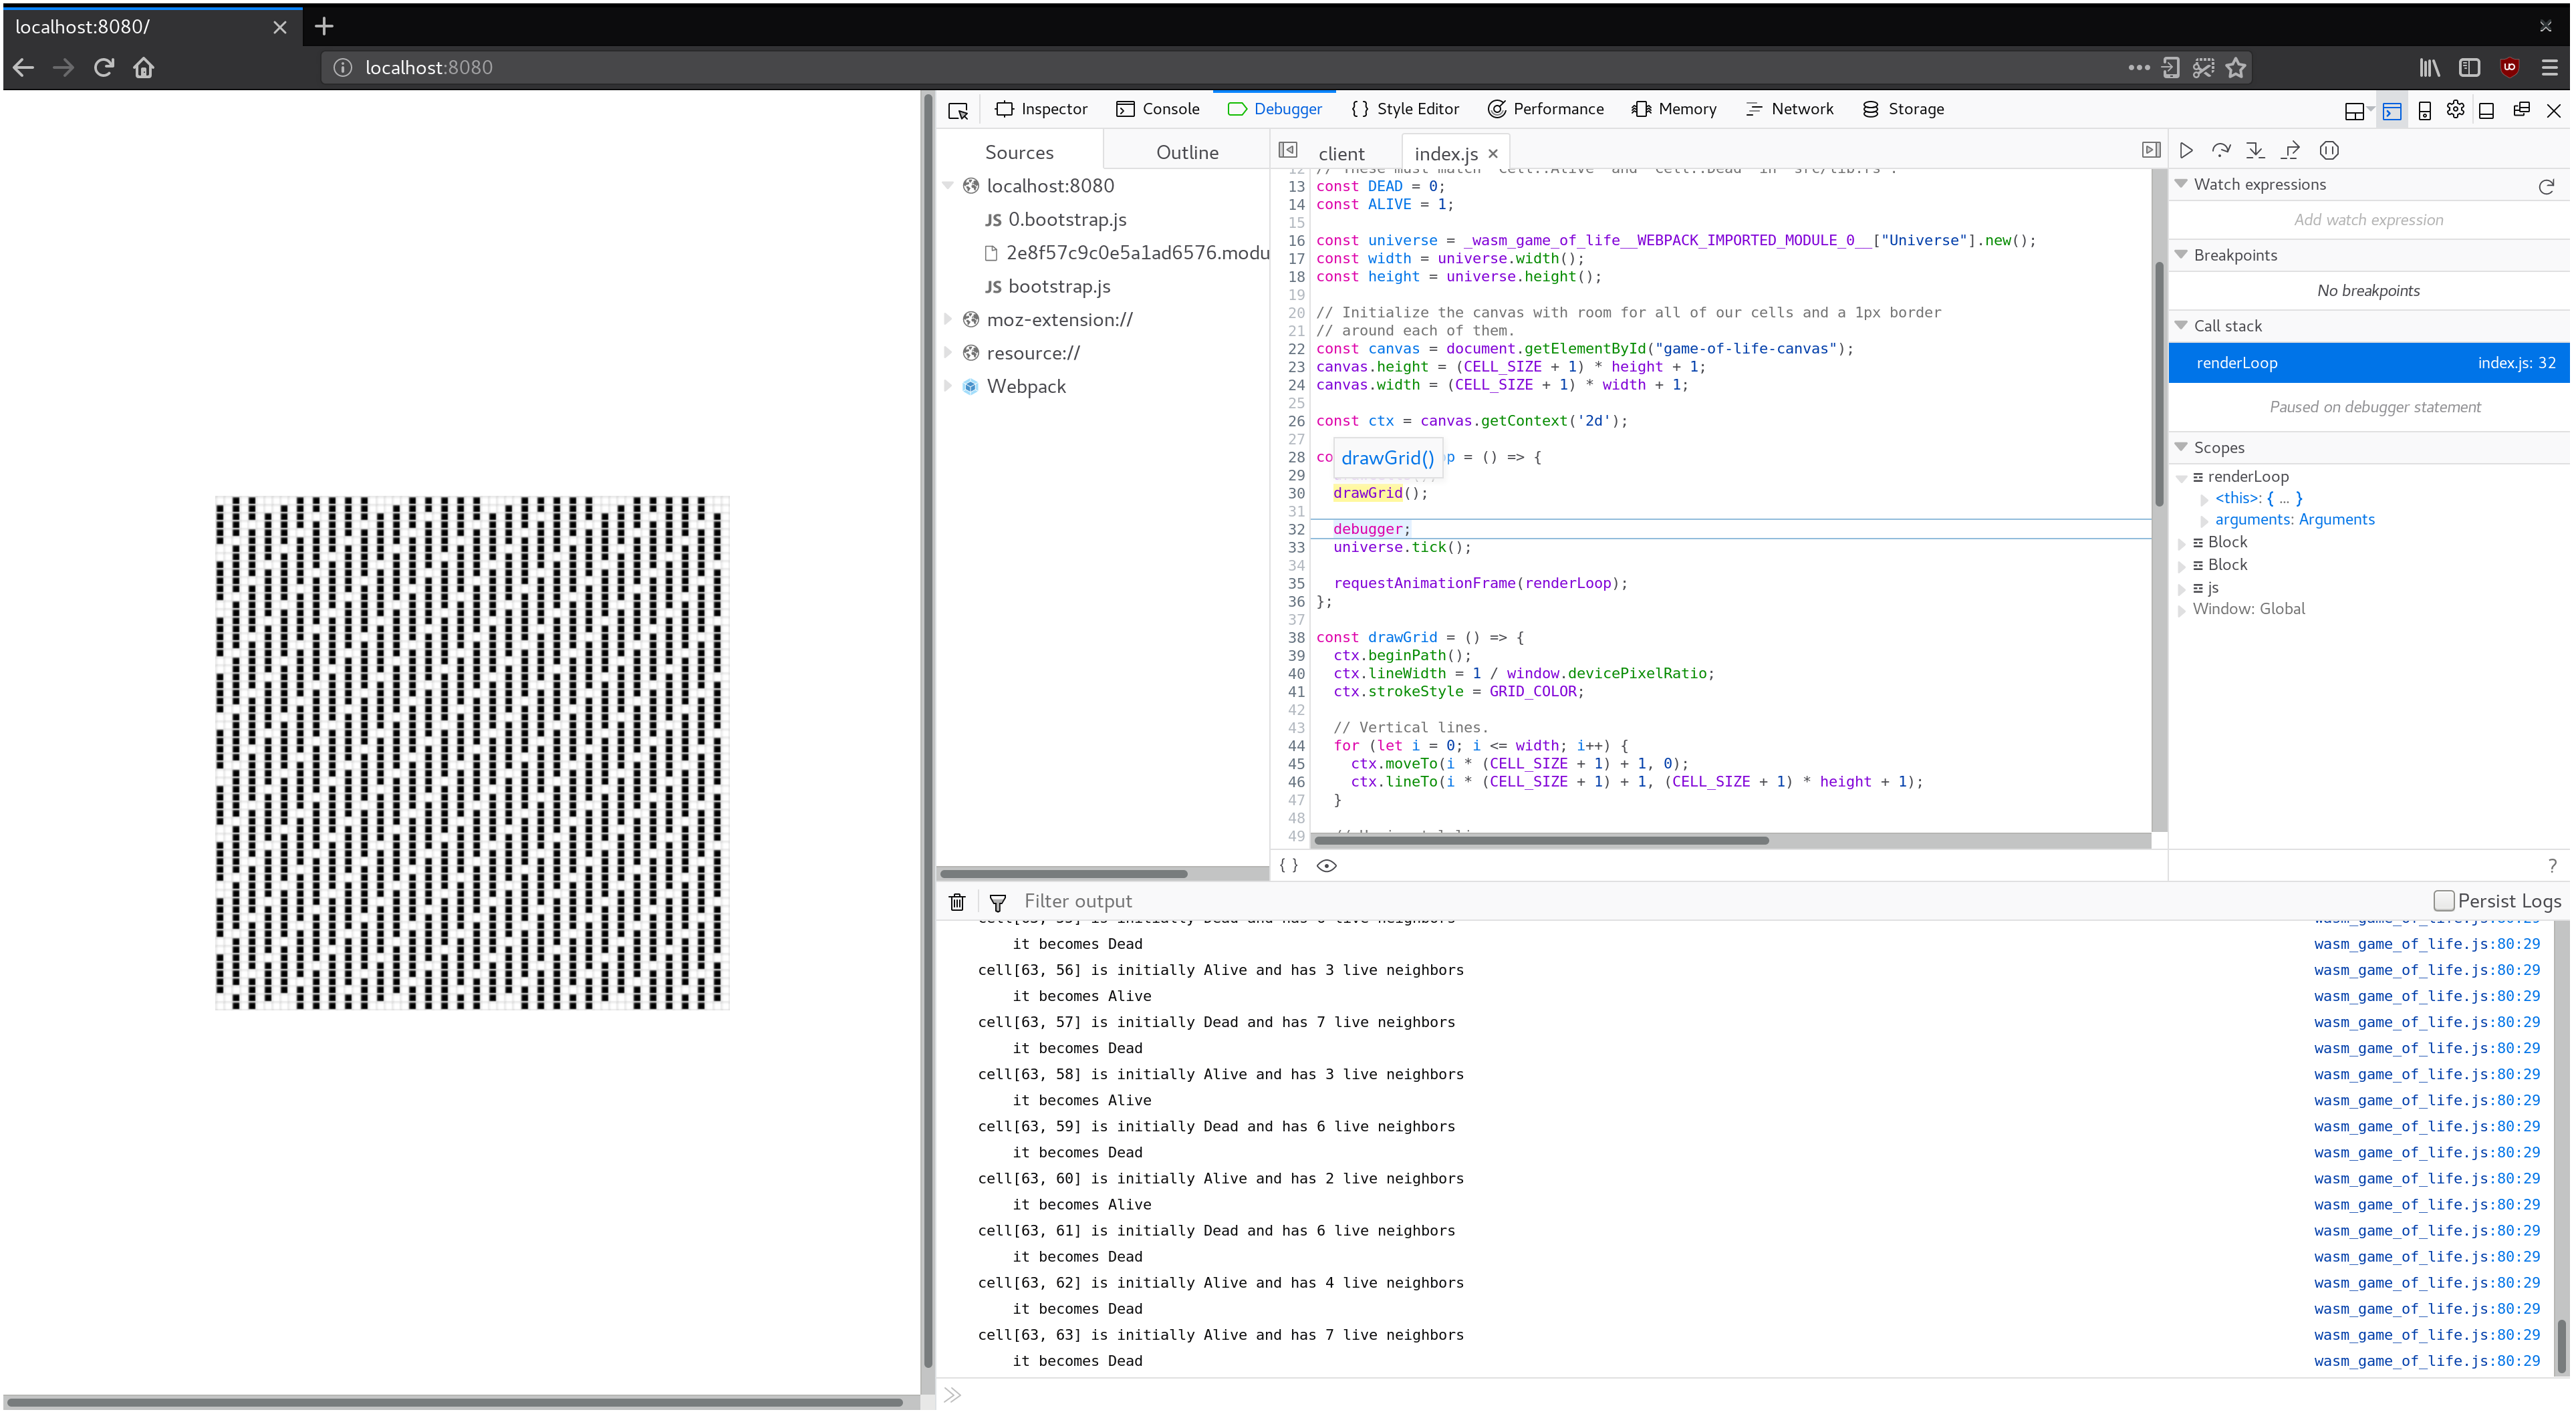
Using a Debugger to Pause Between Each Tick
For example, we can use the debugger to pause on each iteration of our
renderLoop function by placing a JavaScript debugger; statement
above our call to universe.tick().
const renderLoop = () => {
  debugger;
  universe.tick();

  drawGrid();
  drawCells();

  requestAnimationFrame(renderLoop);
};
This provides us with a convenient checkpoint for inspecting logged messages, and comparing the currently rendered frame to the previous one.
Exercises
-
Add logging to the
tickfunction that records the row and column of each cell that transitioned states from live to dead or vice versa. -
Introduce a
panic!()in theUniverse::newmethod. Inspect the panic's backtrace in your Web browser's JavaScript debugger. Disable debug symbols, rebuild without theconsole_error_panic_hookoptional dependency, and inspect the stack trace again. Not as useful is it?